Sewio & FlowUp: Keeping track of your operations with myRTLS Care

In spring 2021, we were approached by Sewio regarding a collaboration on the myRTLS Care project, serving as a monitoring and prediction extension of their real-time localization system. Sewio needed to speed up their development process of the system’s front-end, which we were happy to help with.
Hardware components data visualization
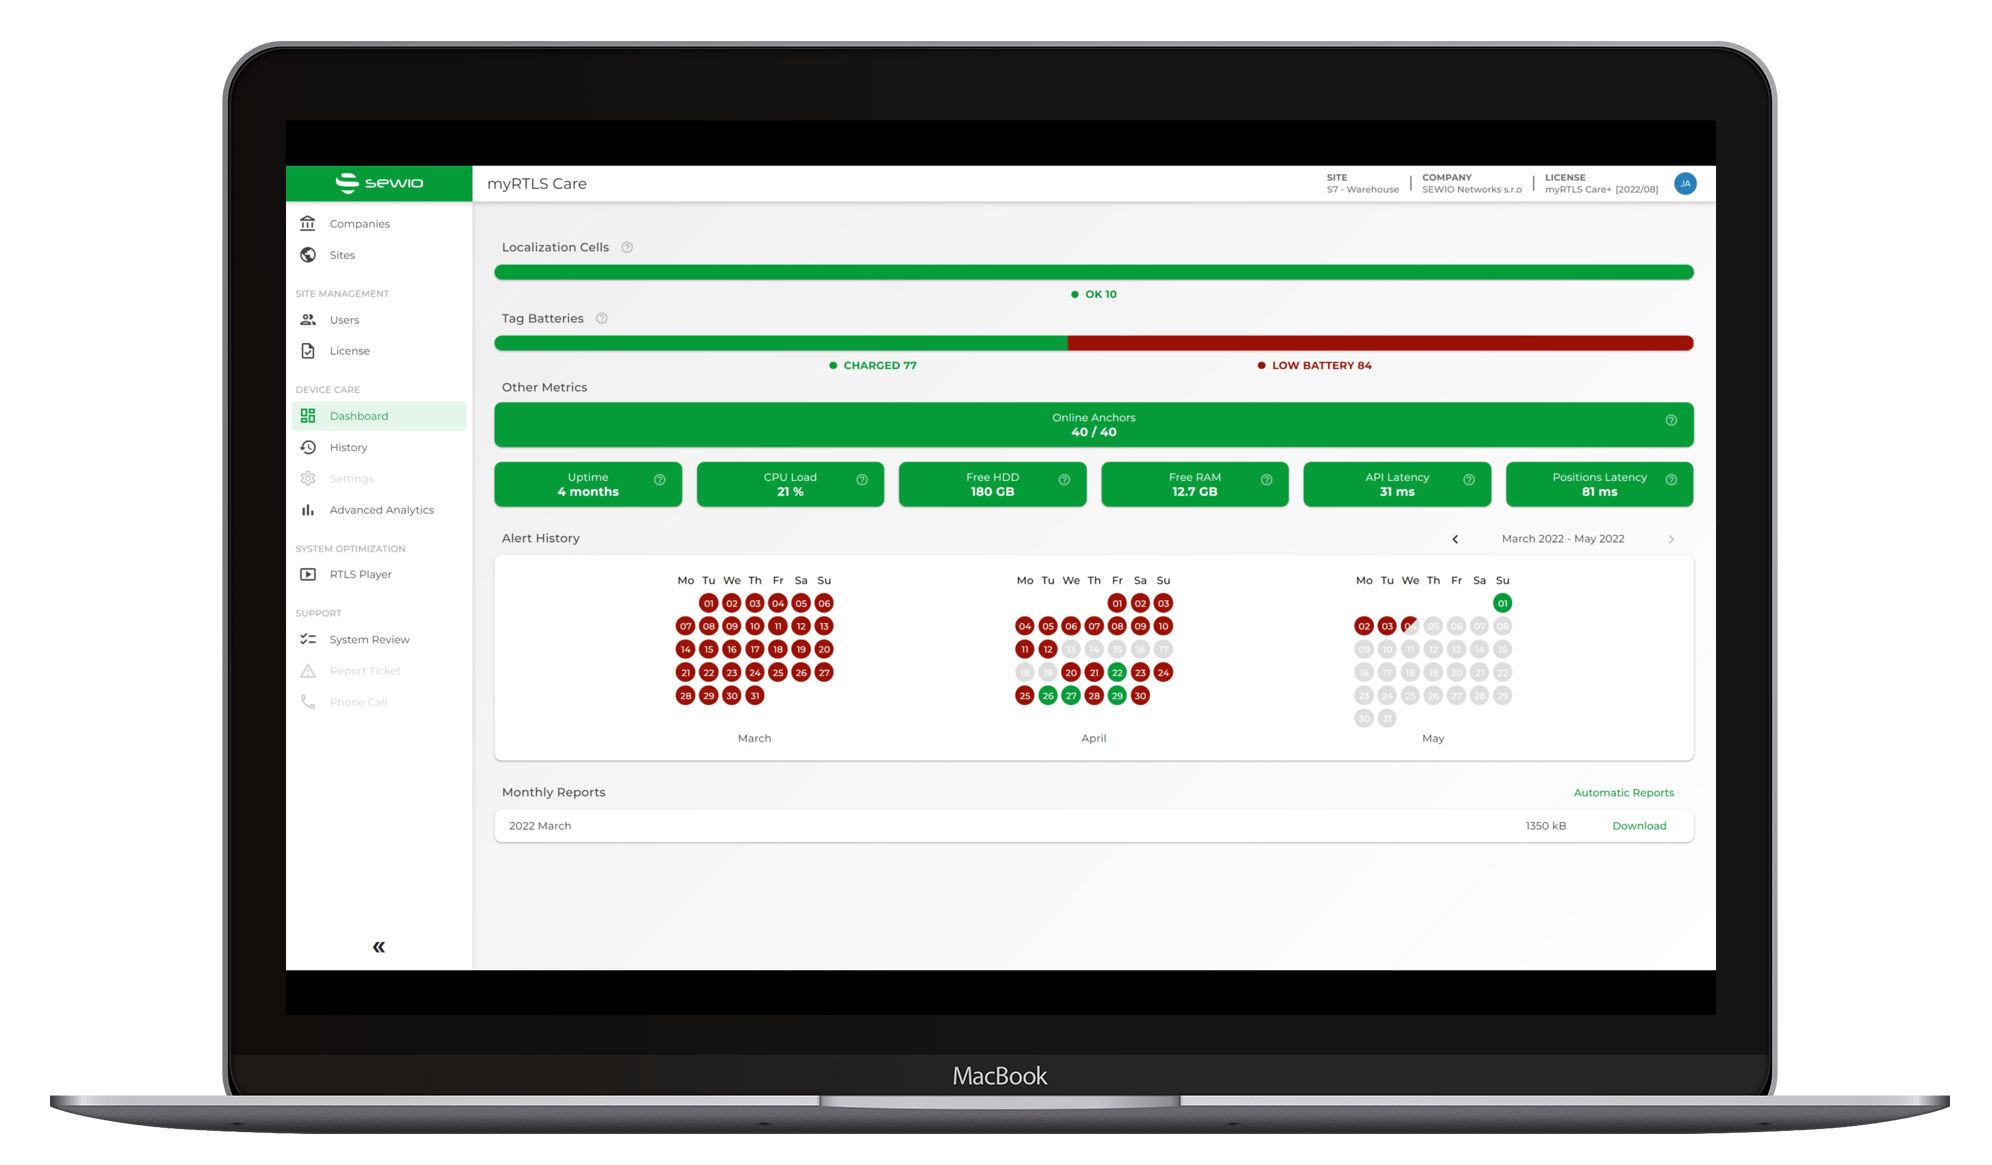
Our task was to create a graphical dashboard visualizing hardware components' data, whose content would vary based on the user role. Each user could display and filter data on this dashboard based on various metrics and variables (such as a date range). They would also be able to export the displayed results, typically in the form of a graph, as a PDF or CSV file. For the implementation of this dashboard, we were to use an existing UI library.
Research and responsivity
One of the main requirements for the platform was to make it responsive, meaning that the application layout, including displayed graphs, should be readable and structured in an appropriate way for any type of device. The main focus was given to mobile devices.
As there are numerous UI libraries that specialize in visualizing graphs, we decided to look for an existing solution as opposed to starting from scratch. We considered their compatibility for our use case and compared their cost to the offered functionality to find the most worthwhile solution. We then presented the options, as well as their advantages and disadvantages, to Sewio.
The tech we used
In the end, we opted for the Apache ECharts library due to its responsiveness and usability.
The system already had a complete back end located in a shared monorepo, which is where we integrated our front-end application. We built the platform using the Angular Material UI component library based on wireframes provided by the client. For state management, we used NgRx.
The delivery process
We agreed on the time and material form of collaboration at the very beginning. This meant using the agile approach, which in budgetary terms meant paying for our time as opposed to having a fixed budget for the whole project. This allowed for a higher level of flexibility, where the client was able to prioritise what feature we should work on first.
While we are experienced in agile development, every company has their own flavour of agile which works best for them. Thanks to open communication from both our side and Sewio, we agreed on the way of working from the very start which ensured smooth communication and helped us work as one Scrum team. Project management was done by the client, while delivery management was taken care of by our Scrum Master at the time, Katka.
Our process was as follows. Thanks to daily standups, everyone was up to date and had a dedicated time slot to discuss any encountered issues. We also had dedicated plannings for scheduling and prioritising the upcoming work, as well as reviews which allowed for feedback and course correction when necessary. Additionally, we had delivery meetings to review our collaboration every two weeks.
myRTLS Care successfully entered the market in May 2022 and we wish both the product and our business friends from Sewio the best of luck.
The solution delivered by FlowUp fulfilled our expectations to the maximum. Its responsivity, elaborate UX s and speed of delivery were a nice bonus. Thanks to FlowUp's participation, we've sped up the product release process and were able to focus on its marketing and sales.
The interesting thing about this project, from my point of view, was to find out the best approach to the responsive visualization of the chart dashboard within the user interface as the chart’s responsiveness was one of the customer’s highest priorities. The size of the screen on smartphones might complicate the readability of a complex chart when compared to the desktop. Another customer’s requirement I enjoyed was our presentation of chart visualization done using several existing chart libraries and the overall comparison when it comes to the pros and cons of each of them. I think our customers should be aware of the possibility of letting us do the research for them and presenting the results to them along with the pros and cons, including the technical compatibility.
Can you feel the flow?
Drop us a note
Contact us using this form and we'll answer you via email ASAP. If you leave us your number in the message, we'll call you back. Looking forward to hearing from you!
We're based in Brno
Nové sady 988/2
Brno
602 00
Czech Republic


